MAP-Nano
Powerful analysis for Scanning Electron Microscopy and optical images - reproducible segmentation, roughness and size distributions.
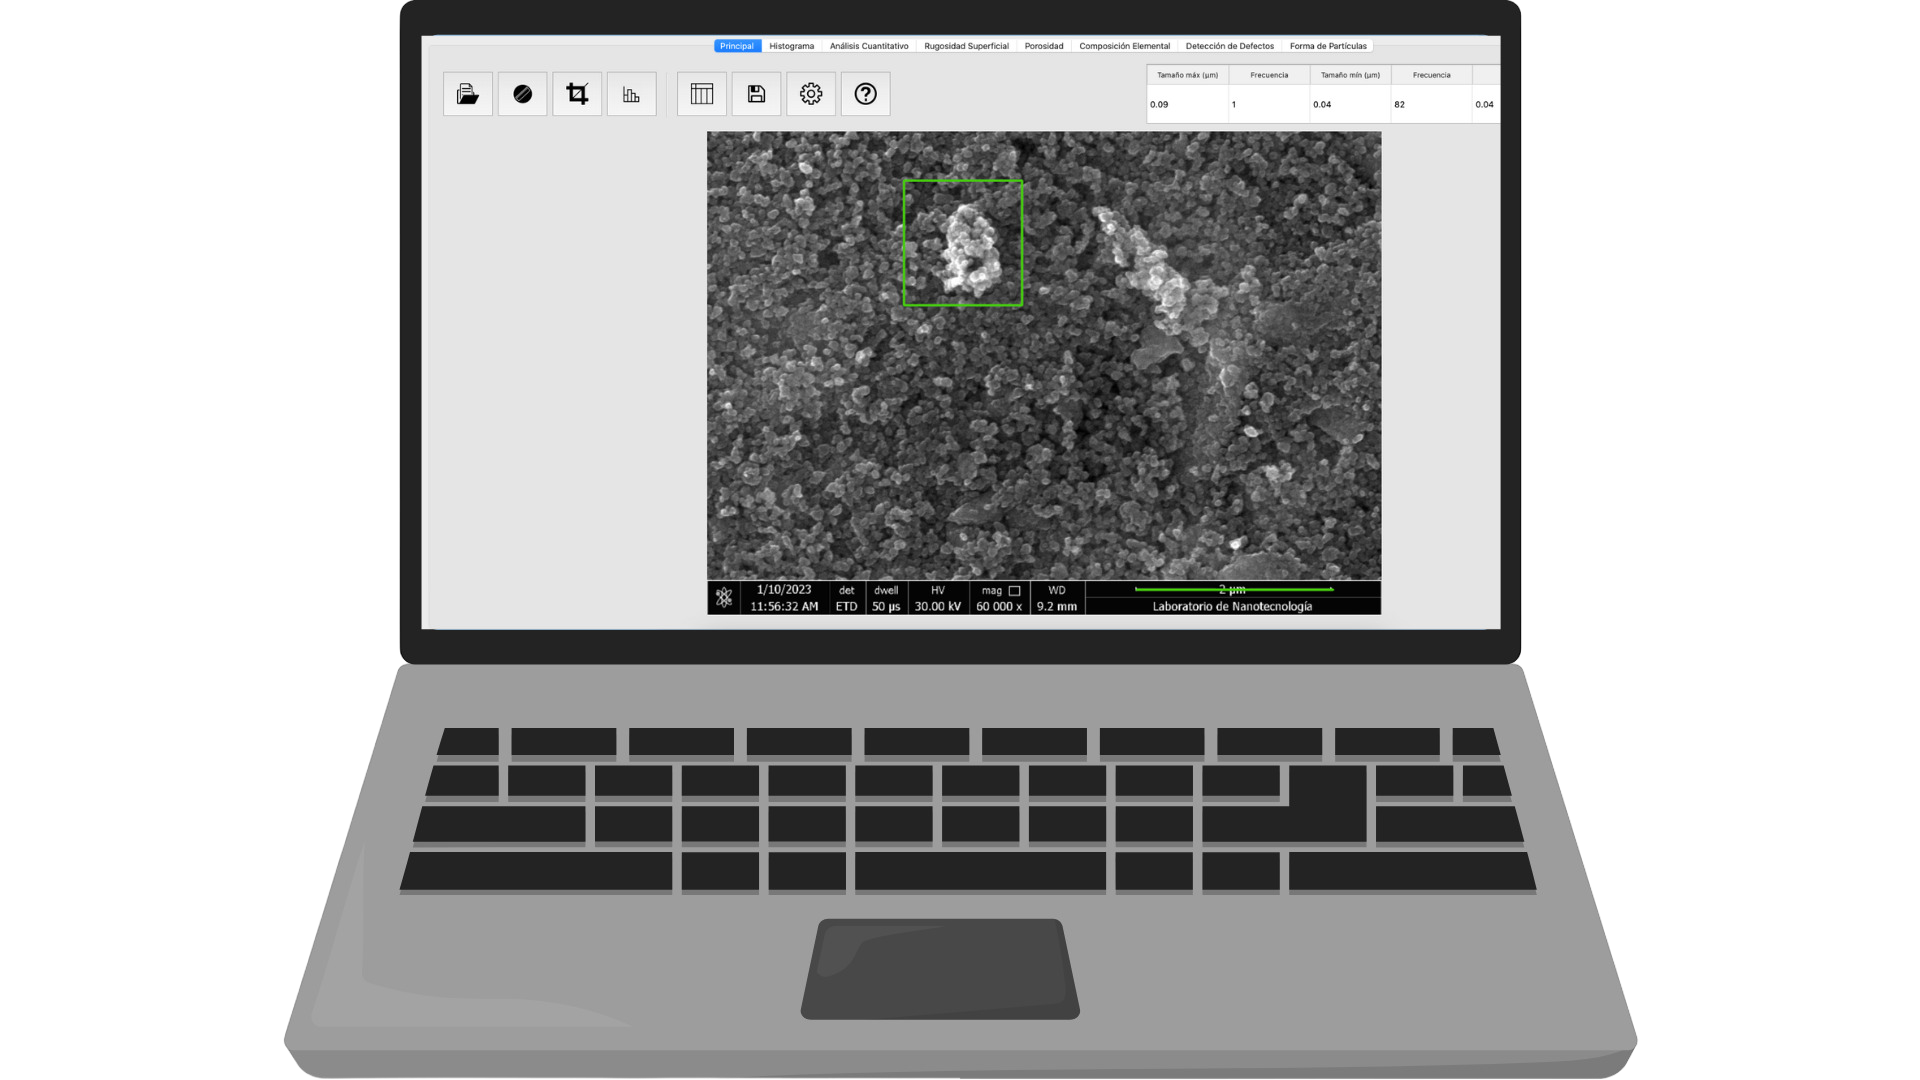
Discover better materials, faster
Using MAP-Nano, the characterization process for novel materials is faster and more accurate than ever before.
Explore our solutions
Choose your area to see typical workflows, inputs and outputs.
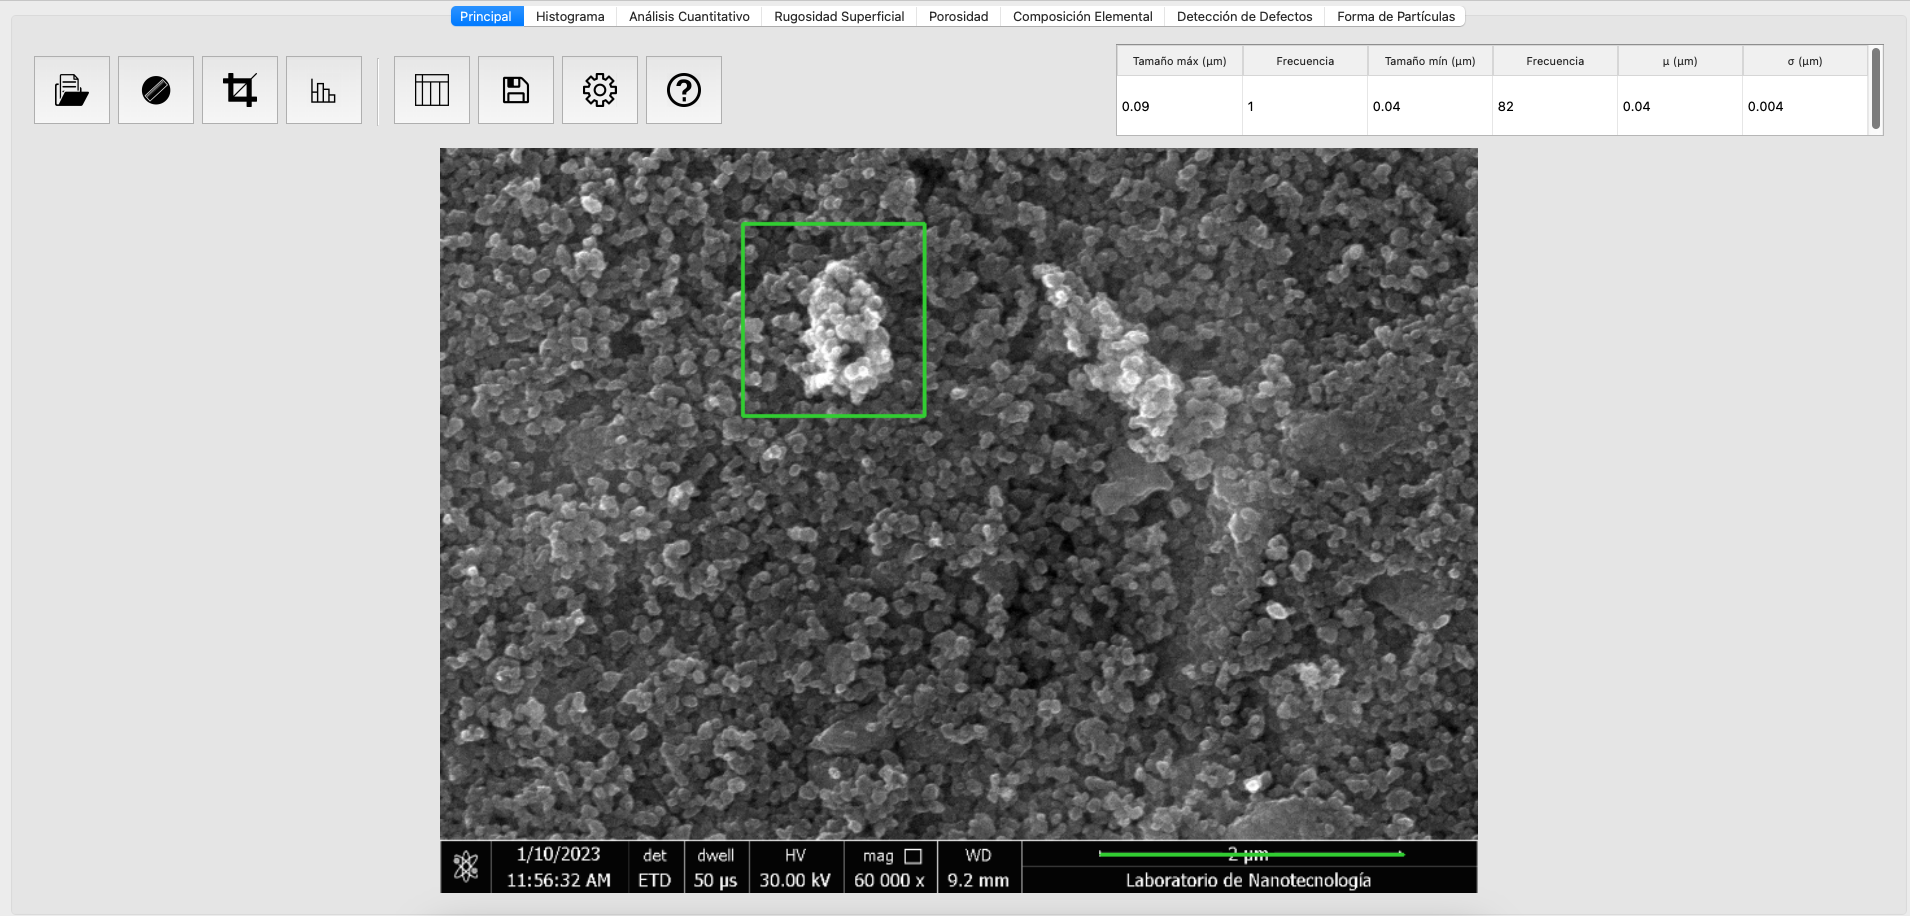
Intuitive UI for fast inspection
Pick ROI and obtain distribution metrics (Weibull/Gaussian), with pre-configured and customizable edge detection.
- Interactive ROI tools with masks
- Batch mode for entire folders
- Traceability and reproducibility
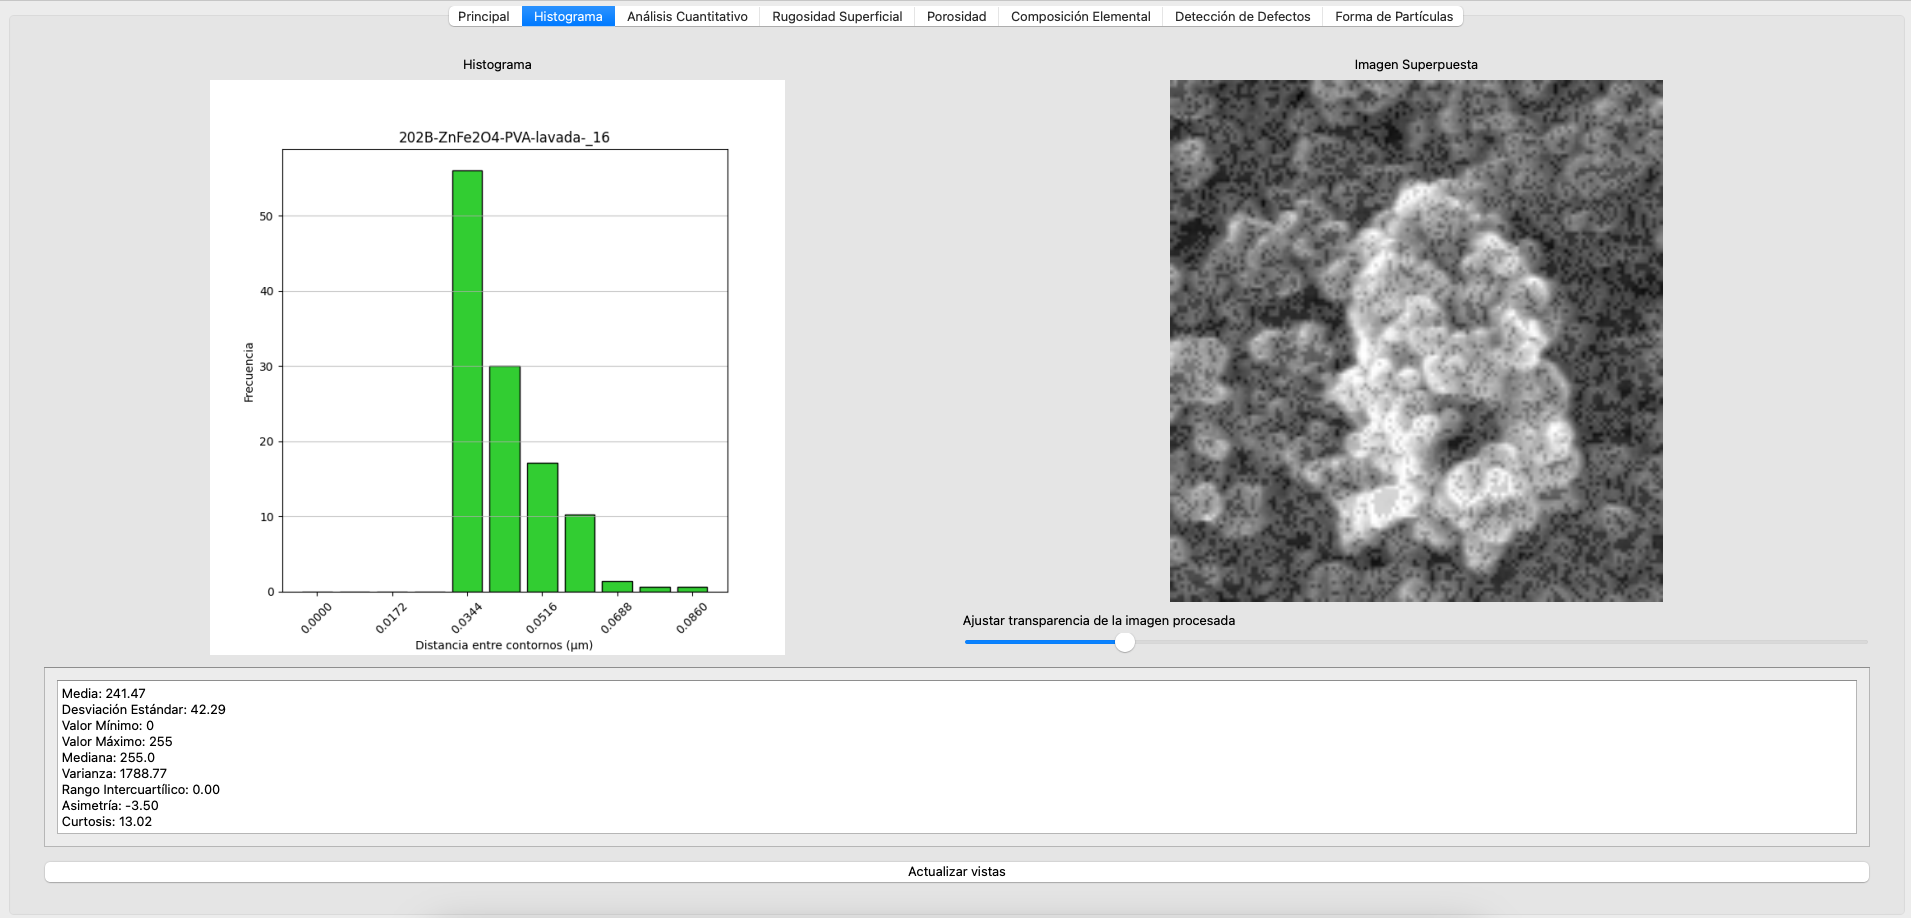
Shape detection & size distributions
State-of-the-art shape fitting to derive robust size distributions and morphological stats.
- Contours, skeletons and curve fitting
- Export to CSV/PDF and API
- Quality checks and outlier control
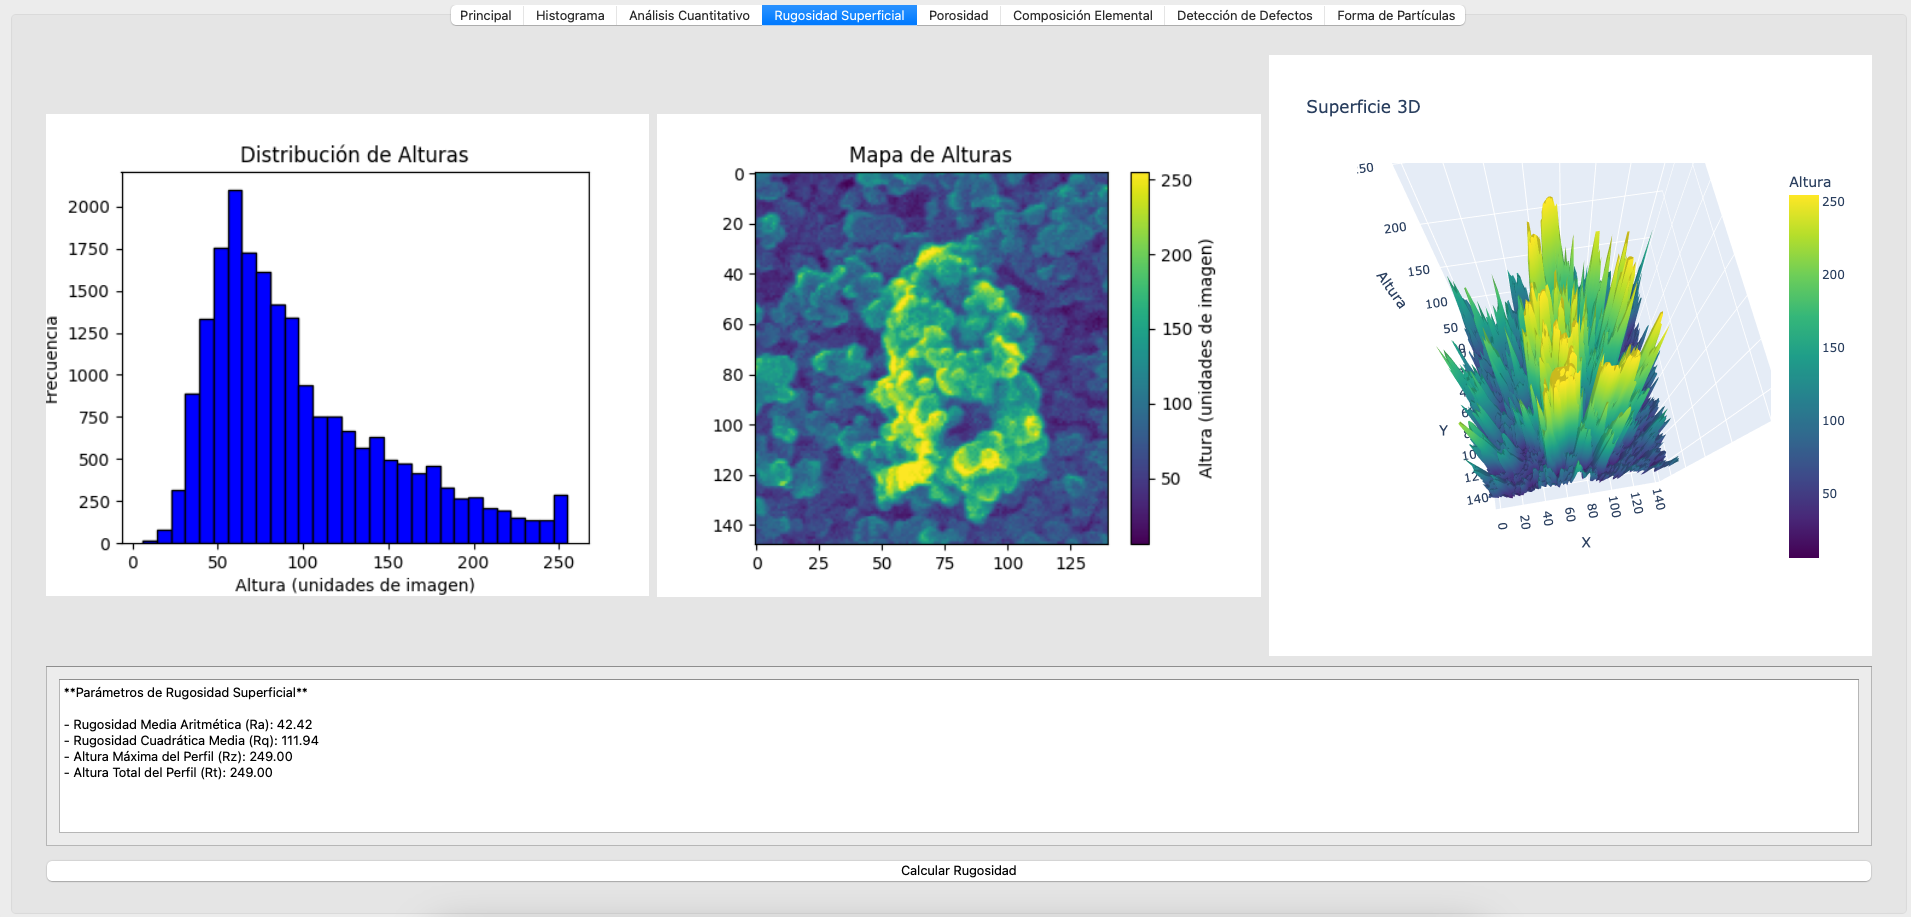
Surface roughness - done right
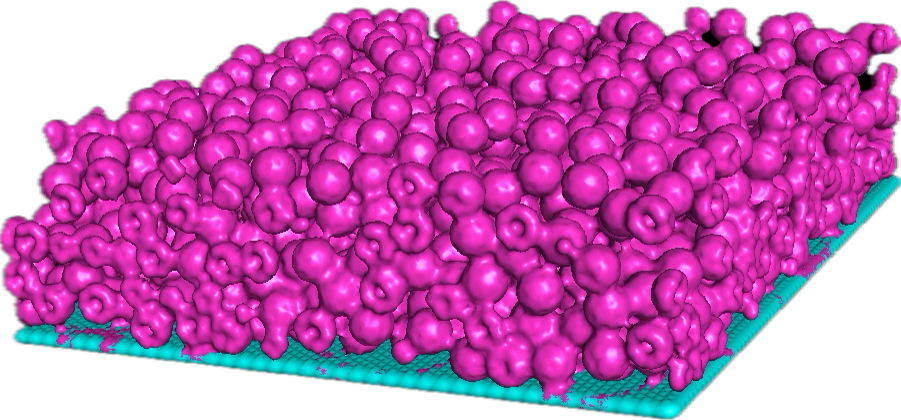
Study height distributions and roughness at different scales; build computational models from experimental data.
- Ra / Rq / Rz and custom metrics
- Multi-scale analysis
- Reports with figures and tables
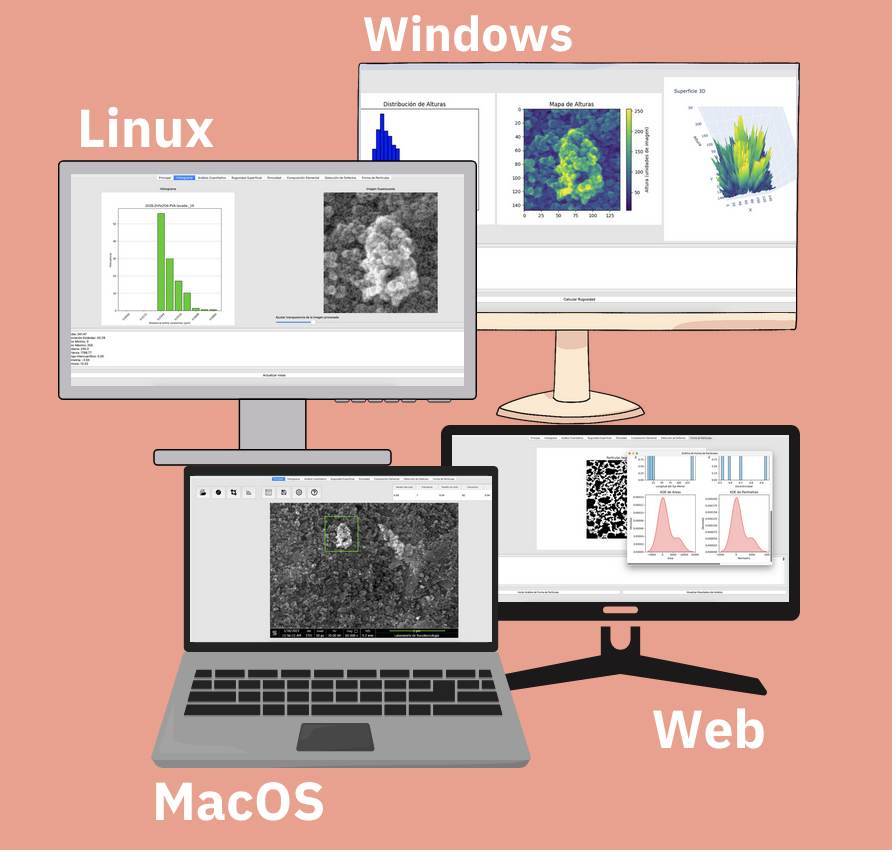
Web & cross-platform support
Run MAP-Nano on the web and, depending on the environment, on desktop. Local deployment remains in beta while we continue refining that version.
- User management and roles
- Versioned analyses
- Guided local deployment (beta)
Technical specs
Inputs
SEM/optical images (PNG/JPG/TIFF), batch folders, ROI masks.
Outputs
CSV tables, annotated images, PDF reports, API JSON.
Algorithms
Thresholding, morphology, contour/skeleton, shape fitting, distributions (Weibull/Gaussian).
Compatibility
Windows, Linux, macOS, Browser (secure web).