The sample
The electrode contacts the liquid sample. The frequency sweep, drawn as the bars of the drop, runs through the sample from high to low frequencies.
From water to data: impedance spectroscopy in your hand.
Pocket EIS to measure liquid samples frequently and get report-ready Bode and Nyquist curves. Also available inline for continuous readout.
How it works
Impedance spectroscopy applies a small alternating electrical signal to the sample and measures how it responds across a frequency sweep. That response describes the sample without altering it.
The electrode contacts the liquid sample. The frequency sweep, drawn as the bars of the drop, runs through the sample from high to low frequencies.
AquaSpecter applies a small AC perturbation and records magnitude and phase at each frequency.
The response becomes Bode and Nyquist curves ready to interpret and report, with the same criteria every time.
Formats
The same principle in a compact device for spot measurements, or built into the pipe for continuous monitoring.
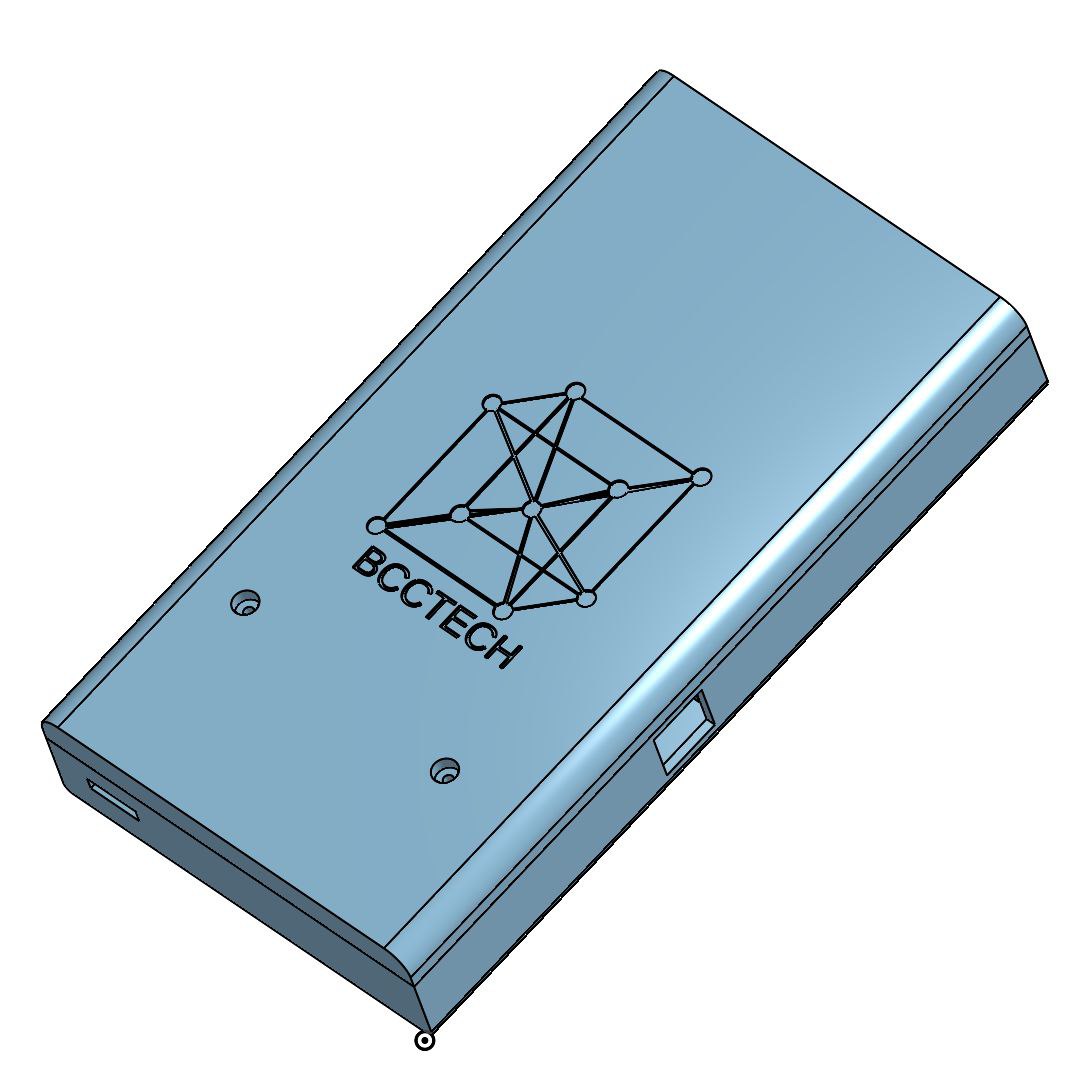
Pocket EIS for frequent measurements and clear readout.
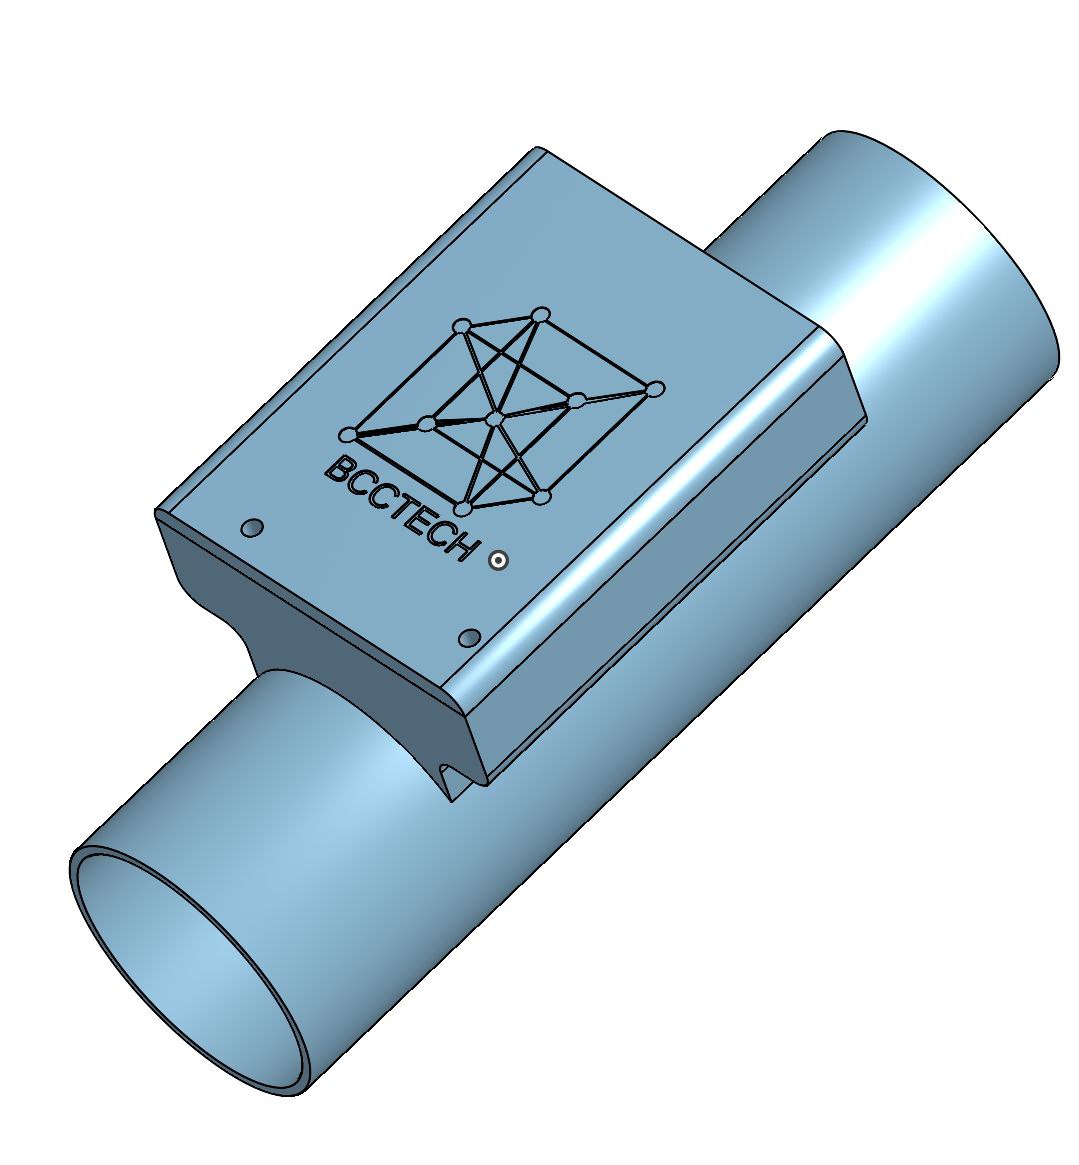
Embedded EIS for continuous liquid-sample readout.
What you get
Every measurement produces the two standard EIS views, in the same format from one sample to the next.
Illustrative curves from a Randles circuit with Warburg diffusion. Not AquaSpecter measurements.
Technical sheet
Electrochemical impedance spectroscopy (EIS) with a frequency sweep.
Liquids: spot validation or continuous in-process monitoring.
Bode and Nyquist curves, reports, and trends in the inline format.
Pocket (compact) and inline (built into the process).
Frequency range, electrodes and protocol are defined with each sample during the pilot.
Guided setup and initial interpretation with the BCC team.
Combine it
Tell us what you need to measure and we will design the pilot with you.